
Read an illustration, and whose it is
Clients trust a table more than a promise. Know what each column means, and which table belongs in the file. Back to your first client.
Start lesson
- 3 short videos · 6 min
- 4-question quiz
In this lesson
-
 2:11
1
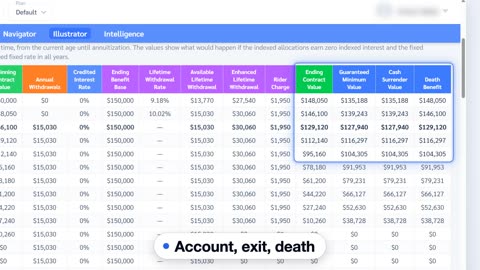
The columns of an illustration
An illustration is a table of values, year by year. Learn what each column means before you trust any number in it.
Done
-
 2:06
2
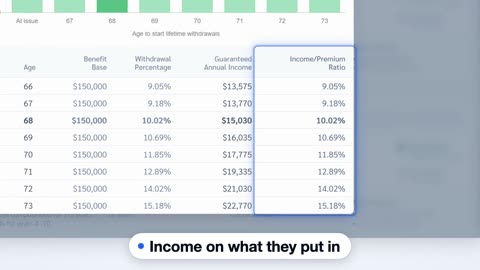
Genius illustration or carrier illustration?
Say the income as a share of the deposit and for the right year. Then show the client the insurer's own illustration.
Done
-
 2:06
3
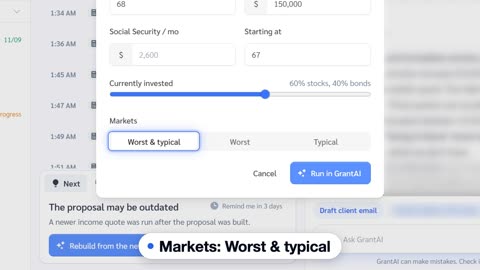
"Average return" is not what you get: order matters
Two retirees with the same average return can end far apart when money comes out. The order of the returns decides.
Done
- 4 questions 4 Quiz: read an illustration Four questions on this lesson. Pick an answer to see why it is right or wrong. Done
You'll open in Genius
Income rider calculator (opens the app in a new tab) your clients (opens the app in a new tab)Uses credits when you open a carrier illustration.