Skip to the lesson

Need, have, how close

Three lines sum up the income gap: what it takes, what they have, how close it gets. Prepare them in the tool below.

Do it in Genius

Income rider calculator row ⋮ Deferral snapshot

Practice Client, 3 Nov 2026: with No income reduction off, the first Indep. Agent row's Deferral snapshot shows Income/Premium Ratio 11.37% from 68.

Rates change every day, so yours will differ.

Open Income rider calculator in Genius (opens the app in a new tab)

In the app: Calculators → Income rider calculator
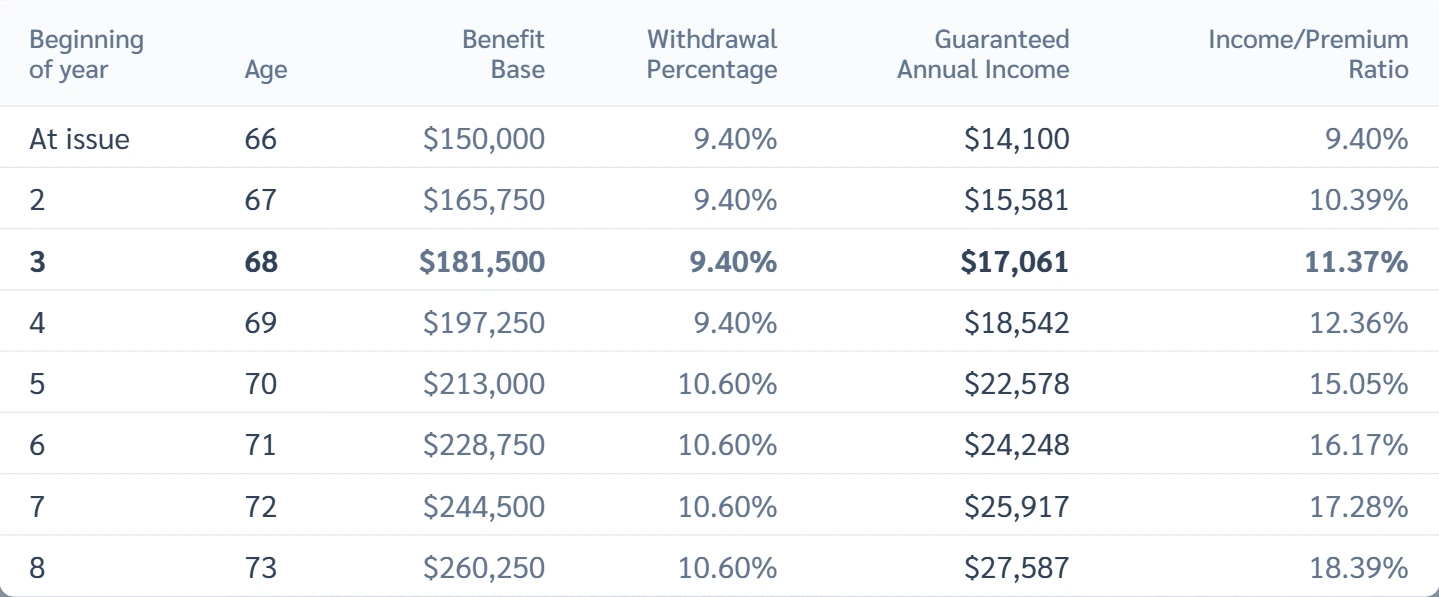
The Deferral snapshot table: benefit base, withdrawal percentage and annual income by starting age, with age 68 highlighted. (opens full size in a new tab)
  1. 1.

    Type the client's essential spending after tax and the steady income they can rely on. The tool shows the gap.

    Not sure what to type? Cover the gap, the part before this one, shows where GrantAI finds these two numbers.

  2. 2.

    In Income rider calculator, open Deferral snapshot. Copy each Income/Premium Ratio into the table, one row per Beginning of year.

    On this row: year 1 (At issue) 9.40%, year 3 11.37%, year 5 15.05%. By year 8, age 73, it is 18.39%.

  3. 3.

    Type one start year in Year for the lines. Read the three lines it writes, then the other rows.

    These are your notes. The client sees the insurer's illustration for this product. Check any age you name against it.

  4. 4.

    Read Breaks even at age: when waiting has paid as much as the first row. Ask how that fits the client's health and plans.

    On a phone, swipe the table sideways to reach this column.

Work out the three lines

Study calculation, not a quote. The starting numbers are made up: type the product's own. It is not an insurer's illustration; that comes only from the insurer or software it has authorized. Show the client that one.

What the client must cover.

Social Security, pensions, other reliable income.

The premium the client would put in.

Used for the break-even age.

A start year from the table.

When waiting pays off

Example numbers, not a quote

Start year Income ÷ premium, % Money it takes Income your money buys Share of the gap Breaks even at age

Ignores tax, interest and inflation. Year 1 is the day the contract is issued; year 4 is three years later. The ratio is for this premium; rerun if the amount changes. Health and other money decide.

The gap each year

Your three lines, for preparation

First line
Second line
Third line

Fix the numbers above to see the result.

How it is worked out

The gap is spending after tax, minus steady income. What it takes is the gap divided by the ratio. What your money buys is that money times the ratio. The share of the gap is what your money buys, divided by the gap. Withdrawal Percentage does not fit: it is a share of the benefit base, not of the premium. Breaks even at age compares each row with the first row. It is the age when the income paid so far is equal. Each row pays a level income from its own start year. A row of year Y starts Y minus 1 years from now. The first row has no break-even age, nor has a row that starts no later or pays no more.

The tool does the math in your browser and does not store what you type. No names or contract numbers needed.

You're done when your three lines are worked out for your notes, with numbers from the product's own Deferral snapshot.
Watch out: The gap is after tax. Contract income can be taxed in full or in part, depending on the money. Ask the client's tax advisor what before-tax income covers it.
Sources